Press Release Details
Press Release Message
San Francisco (October 10, 2024) - The California Department of Education (CDE) today released the results of the 2023-24 California Assessment of Student Performance and Progress (CAASPP) for English Language Arts (ELA) and mathematics. In 2024 the San Francisco Unified School District’s (SFUSD) ELA and math proficiency rates continued to be higher than the state, which has been the case since 2016. The CAASPP was not administered in 2020 and 2021 due to the COVID-19 pandemic.
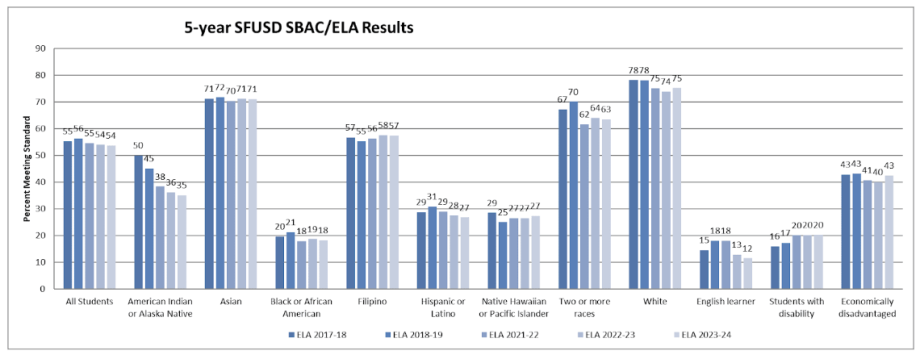
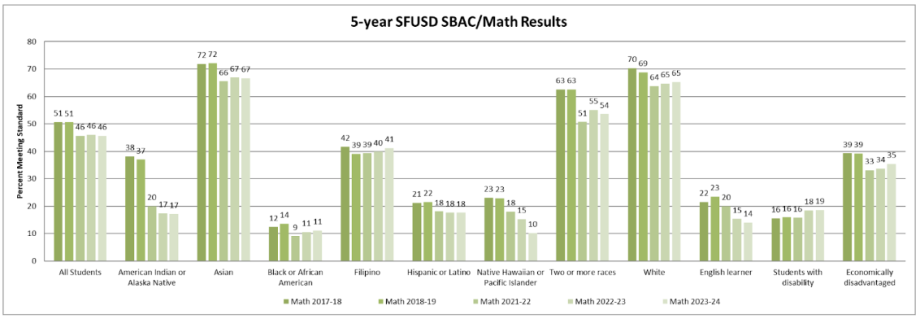
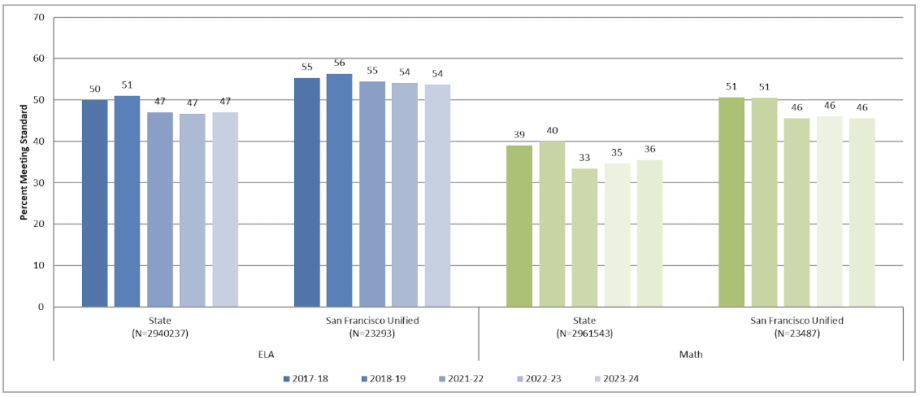
Overall, SFUSD the student proficiency rates for SBAC English Language Arts (ELA) was 54%. ELA proficiency rates continue to be above 50%, remaining relatively steady for the last two years. The state’s proficiency rates for SBAC ELA was 47%. Overall, SFUSD student proficiency rates on the SBAC math remained steady from 2022-23 to 2023-24 (46%), with similar trends seen across most student groups. The state’s proficiency rates for SBAC math was 36%. However, the proficiency rate change from last year to this year remains steady for SFUSD and the state. (See Figures 1-3 for details).
Over 23,000 students were assessed in one or both content areas (ELA and Math) of the Smarter Balanced Assessment (SBAC) in the spring of 2024 in grades 3 through 8 and 11, marking the third year for testing since spring 2019 (pre-pandemic). Students in grades 5, 8, 11, and 12 also participated in the California Science Test (CAST).
“We have set ambitious goals for student outcomes, especially in math and literacy, which remain a top priority for SFUSD,” Superintendent Dr. Matt Wayne said. “While we are making meaningful strides in this important work – such as launching our first new PK-8 ELA curriculum in over a decade – there is still much to accomplish, particularly in bridging the persistent opportunity gaps that our students face.”
Through planning and investments aimed at addressing the opportunity gap and re-engaging all students, SFUSD has prioritized enhanced summer learning and credit recovery offerings, targeted literacy interventions, extended learning time, and the implementation of equity-focused actions for historically underserved groups. Overall and across all student sub-groups, SFUSD saw an overall decrease in chronic absenteeism over the last three years, from 29% (2021-22) to 26% to 23% (2023-24), which is aligned with the district’s targeted efforts to improve student attendance.
Schools that have an overall proficiency rate above 75% in both content areas, ELA and math, are Chin, Sunset, Peabody, CIS, Ulloa, Lafayette, Lilienthal.
Notable SBAC math proficiency rate increases from 2022-23 to 2023-24 were seen at three Math Lesson Study grant schools: John Muir Elementary (+20%), Flynn Elementary (+13%), and Sanchez Elementary (+8%). Collectively, the Lesson Study schools saw double-digit growth at each grade level (grades 3, 4, 5) over the last three years. Lesson Study uses the Teaching Through Problem Solving as a whole school approach to improving mathematics outcomes for focal student populations.
“It’s inspiring to see so much progress among students in schools that use Lesson Study, a promising practice that SFUSD began piloting in elementary schools several years ago in partnership with the City of San Francisco,” Board of Education President Matt Alexander said. “This style of teaching promotes student agency and emphasizes problem solving. We are grateful to our educators and City partners for working together in support of student outcomes.”
The San Francisco Board of Education and Superintendent Wayne are committed to improving student outcomes and the district has set three long-term goals for student outcomes: increasing the literacy of all 3rd grade students, increasing the math proficiency of all 8th grade students, and increasing the percentage of high school 12th graders who are college- and career-ready.
###
Figure 1: SBAC ELA Proficiency across Groups (2017-18 to 2018-19; 2021-22 to 2023-24)

Figure 2: SBAC Math Proficiency across Groups (2017-18 to 2018-19; 2021-22 to 2023-24)

Figure 3:
SBAC ELA & Math Comparison between State and SFUSD (2017-18 to 2018-19; 2021-22 to 2023-24)


